analysis of scientific targets
I now have several “scenarios” generated. Each scenario covers the evolution of a target coastal region over 50 iterations. As explained in here, a simple model was built that allows an input “entities” image file to grow and decay. Each entity is assigned a particular color. I am working with 4 entities. I am not making any scenarios with fewer than four, since I can simply ignore any colors that I am not interested in.
The path planning needs to use these entities and their evolution to determine interesting areas. The basic plan is that each cell on the map has some “interest level”. The interest level of a path can then be found by simply summing the interest level along the cells in that path.
Interest in a particular substance would be highly domain specific, so I am not attempting to propose a complete solution. However, one of my main objectives with the path planning is to demonstrate optimization using both science/target goals and environmental constraints.
I have selected two generic aspects of entities that would be interesting. The first is based on coverage. Consider the case where you have 4 entities: each a species of seagrass. The boat can take video recording, water samples, etc. You would want somewhat even observation of the entities of interest. (Or “evenly” with weights attached to each entity). Therefore, entities that have been observed less proportionally than the others would be more interesting. Also, the recency of these observations would be involved. Part of the appeal of long-term path planning is that the boat would be on missions long enough that earlier observations might not capture the current characteristics of the entity. So, interest level of an entity should grow for the time that is goes unobserved. Otherwise, if you have a very large percentage of time studying entity X, it would be ignored in favour of entity Y even if those observations were from long ago. This “recency-weighted coverage objective” should be fairly straightforward to code as the interest levels are not related to the spatial layout of the entities or their characteristics.
The other interesting aspect is related to characteristics and distribution of the entities themselves. The boat will receive periodic updates regarding the state of the entities. This is as if it received an overhead view from a satellite or companion UAV. If the rate of change of the entities changes, its level of interesting would be proportional to that rate. If the growth of that entity sped up slightly, it might not be of any significant interest. But, for a few examples, sudden appearance of holes could indicate damage from humans or environment, faster decay could be from disease, and faster growth could indicate some change in water quality.
I am currently working on how to implement detection of that aspect. The behavior of entities is, in real life, not uniform across the region. So I cannot simple find the acceleration of the number of cells of that entity. It should focus on the change within smaller regions. I had 2 ideas on how to approach this.
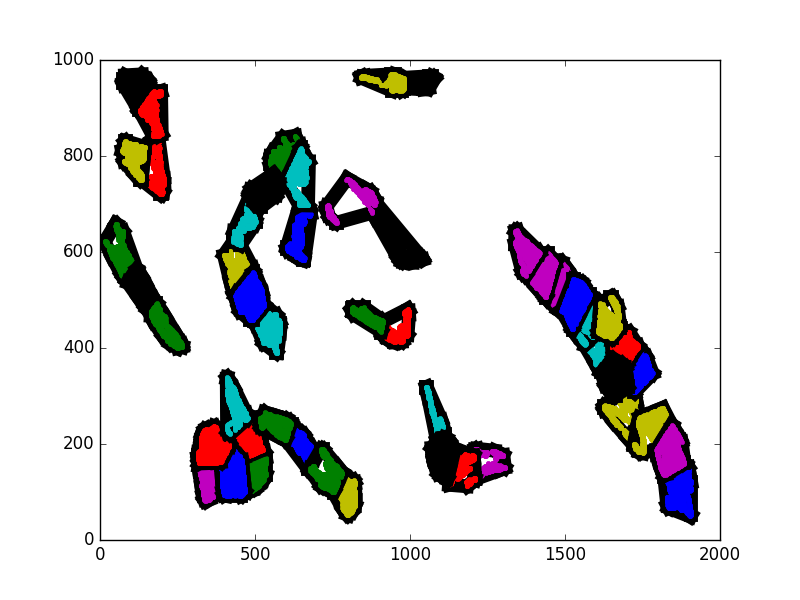
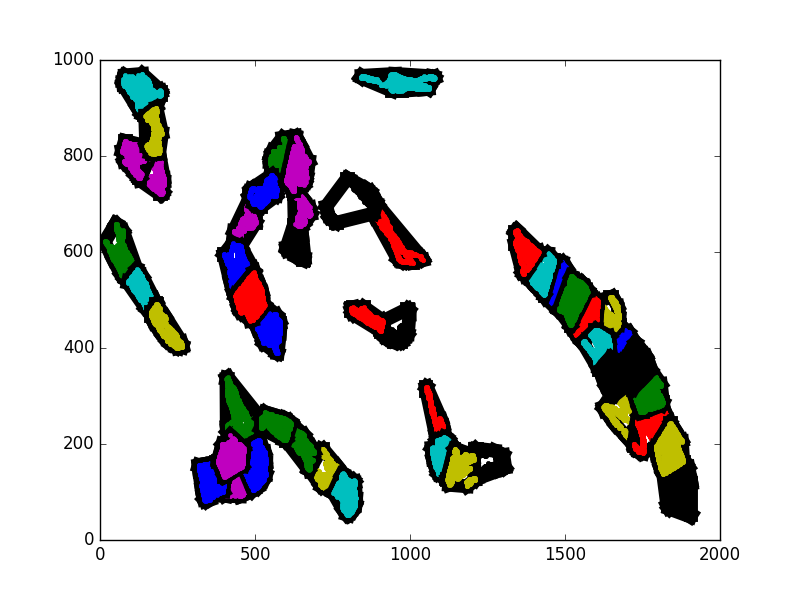
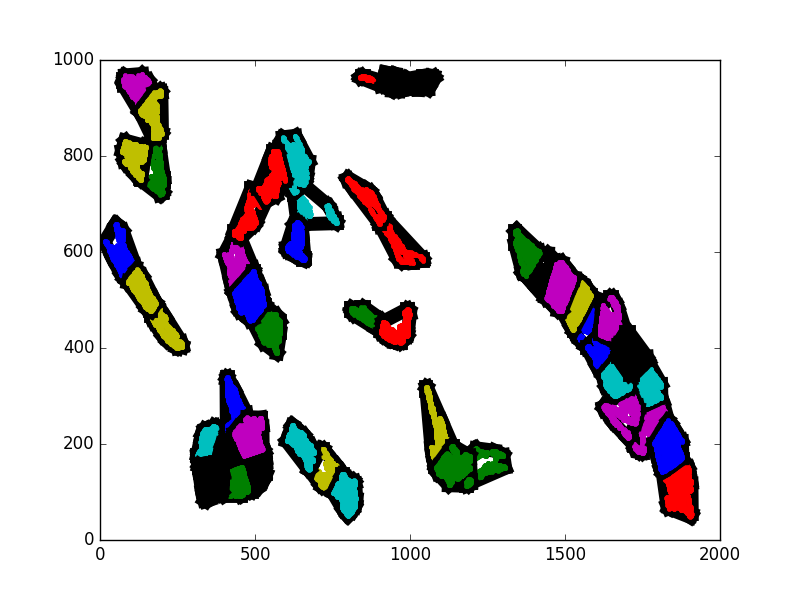
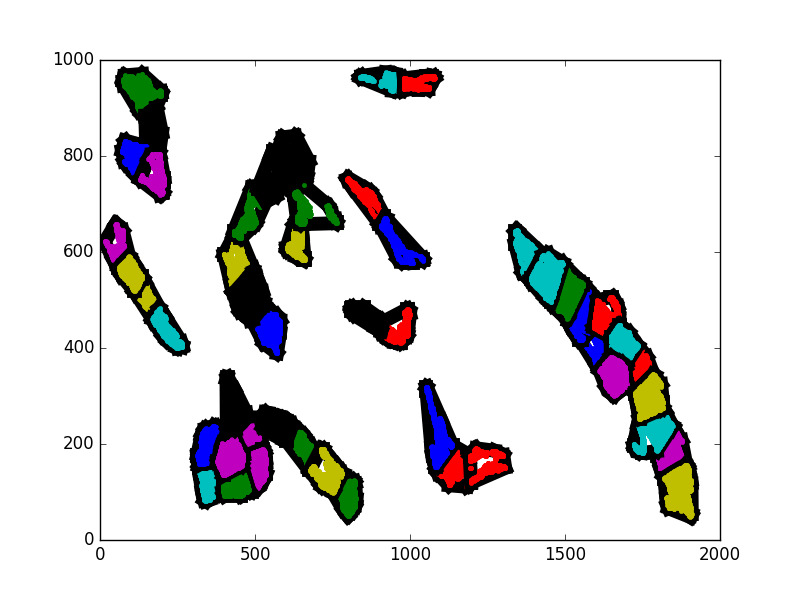
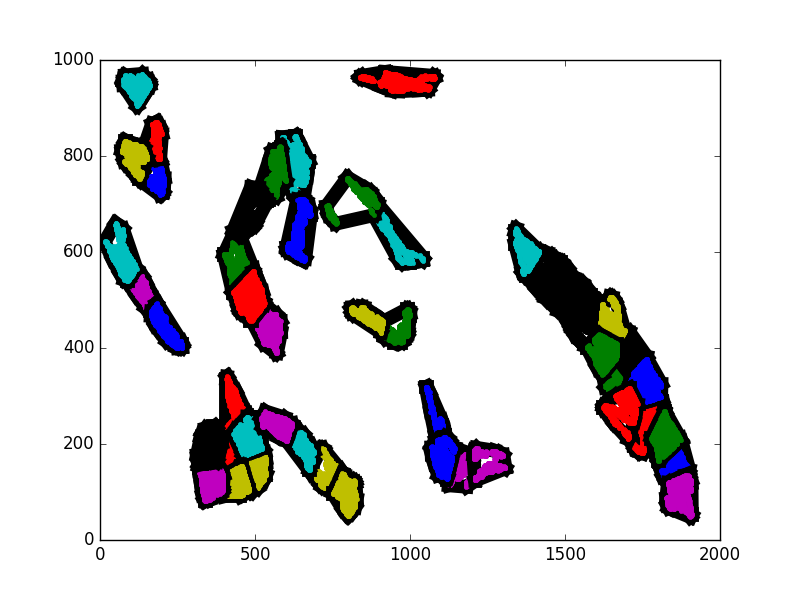
Idea 1 was to use clustering to find groups of that entity. As if finding colonies of seagrass. I have done some work in Python with Kmeans to cluster. My hope was to see how the characteristics such as shape and density of those clusters changes over time. My concern was that the clusters might not be stable enough. Since you have to specify a “K” numbers, individuals cluster size and shape can change based on changes in unrelated areas. For example if you have 3 clusters, but the third cluster decays some, all three clusters may change shape. It is hard to then determine what actually caused the change. I think that Kmeans is not stable enough to capture the changing state of the clusters in the way that I am looking for. Initial tests seem to support my concerns.
In the following 5 images, some sampled iterations are shown of a on of the entities in a scenario. I have not used consecutive iterations so that the change is more apparent. Notice how the cluster near the middle changes dramatically, but without really revealing anything about what actually happened. Since the actual spatial shape of the clusters is not constant, it is difficult to track changes within them over time.
My other idea was to simply lay a grid on top of the region. I know that the region is already represented as a grid, but I mean that, for example, a 25x25 block could be a subregion. The activity of entities in the subregions could be directly measured. This is much more straightforward, but to code and for the computer to do. I am sure that, given the time to work with it, I could find a more sophisticated machine learning approach to capturing region clusters. However, this project has a large numbers of components that need to exist. I have spent longer than intended on the scientific regions aspect.